For my final project I thought it would be interesting to represent the music data that is dynamically posted through my app in something this WWDC app wall. The app wall was a live representation of the apps that were currently being downloaded in the world on the App Store, and would appear and flow down into this piece that you could look at.
The idea around this is that you could see in real time the apps and data that people were posting into an object. They were sorted by color and you could really understand certain trends that were happening through certain periods of the day.
My idea would be to take the data I get from music because I have the color, time of day the piece of music, and details about the piece of music was posted and where, it’d be interesting to build an installation piece that takes inspiration from the app wall. I’d want people to see and understand what music people currently are listening to. It’d take some tweaking and not be on this sort of scale but I think some way of representing data to people could be intriguing and show trends in the same way. You can learn and infer a lot of points about data when you see it in this format. 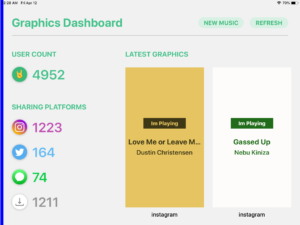 This is a screenshot of our dashboard with some of the real time statistics that we have now and might be incorporated in some form of the final project.